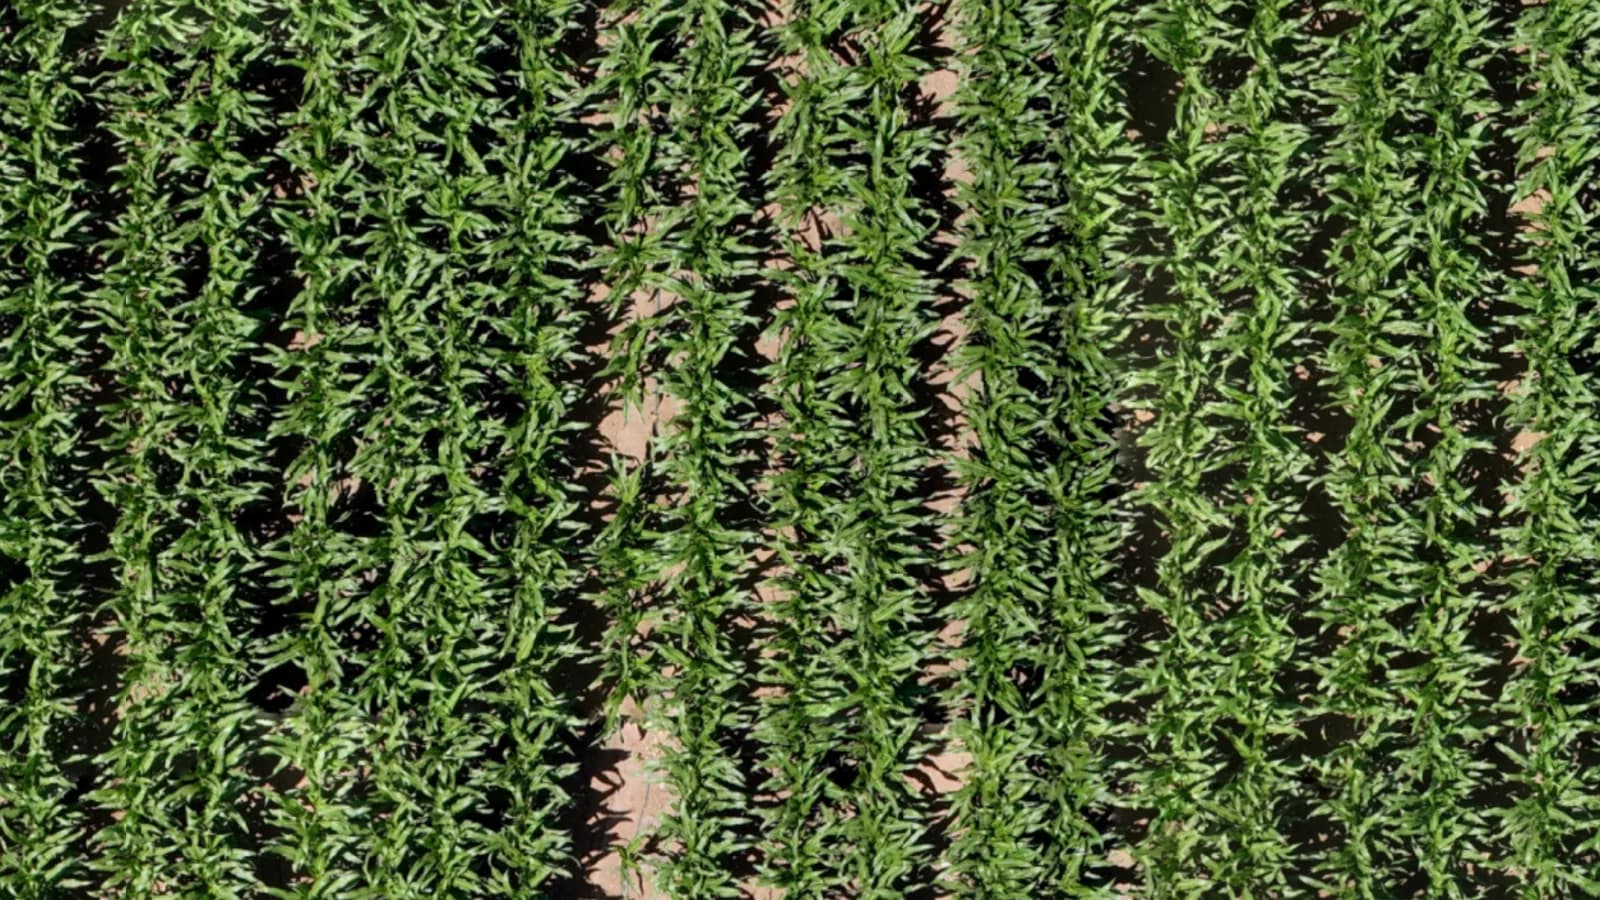
The challenge
Draft — sample dataThe operation covers about 1,140 acres: winter wheat in five blocks strung along eight miles of road, and avocado on terraced slopes. One field agronomist from the regional input distributor advises this grower alongside many others. An independent pest scout walks the orchard.
- Five wheat blocks, miles apart, mostly judged from the field edge between other jobs.
- An orchard with more rows than a scout can walk in a week.
- Problems were found when someone happened to pass them, not when they started.
“I used to hear about a problem when somebody happened to drive past it. Now we look at the whole field first and walk to the marked places. That is why we ordered the next scan.”
What was done
Draft — sample dataInfrag flew five scans between December 2025 and April 2026, each timed to a decision. The first, over 500 acres of wheat after emergence, was free. The grower ordered the other four. Each time, the agronomist and the scout opened the map before going out, asked the AI Advisor about what looked off, marked the suspected areas and walked to those first.
- Three wheat scans: after emergence, before the herbicide decision, and after the pass.
- Two orchard scans, in February and April, compared side by side.
“I check an orchard by rows, and nobody walks every row every week. With the February and April scans side by side, I knew which rows to walk first.”
What the maps showed
Each finding below was a suspicion on the map first. It became a fact only when someone checked it on the ground.
Winter wheat · December scan, after emergence
Draft — sample data- What the map showed
- Thin, uneven strips along the eastern edge of two blocks. The agronomist marked four of them as suspected emergence gaps.
- What the ground check found
- Three were gaps where the seed drill had run light. The fourth was a wet corner that had filled in by January.
- What the adviser did
- Nothing was reseeded: the agronomist judged it too late in the window. The drill rows were noted for the grower's pre-season service.
Winter wheat · January scan, before the herbicide decision
Draft — sample data- What the map showed
- A patch in the northern block with a different color and texture from the wheat around it. Asked about it, the AI Advisor outlined it as a suspected broadleaf weed patch and, on request, marked thirteen similar areas across the five blocks.
- What the ground check found
- The agronomist walked to all fourteen. Eleven were broadleaf weeds. Three were not: two were bare, stony ground and one was animal damage.
- What the adviser did
- The eleven confirmed patches sat in two of the five blocks. The agronomist recommended a herbicide pass on those two blocks and none on the other three. The March scan, set beside January's, showed the grower what had changed.
Avocado · February and April scans, compared
Draft — sample data- What the map showed
- With the two scans side by side, five places stood out where trees had thinner canopy than their neighbors. The pest scout marked each one as a suspected problem.
- What the ground check found
- Three were real: two rows fed by a blocked irrigation line, and a group of trees standing in wet ground at the foot of a slope. Two were younger replants, smaller only because of their age.
- What the adviser did
- The line was cleared that week. The scout asked for the low corner to be scanned again after drainage work, to compare.
“It never told me what a patch was. It told me where to walk. Seventeen of the twenty-three places were worth the walk, and I would rather check six for nothing than miss one.”
“From the ground, each of those trees just looked a little tired. From above it was one straight line of them, and a straight line in an orchard is usually a pipe.”
What changed
There is no yield figure here. These numbers describe what was looked at, how often a suspicion held up, and whether the grower came back.
1,140 acres
mapped over five scans, December 2025 to April 2026
Coverage
“With two scans side by side, I knew which rows to walk first.”
17 of 23
suspected areas confirmed when checked on the ground
Ground truth
“From above it was one straight line of tired trees, and a straight line in an orchard is usually a pipe.”
4
paid scans ordered after the free first one
Repeat orders
“Now we look at the whole field first and walk to the marked places.”
“What a grower buys from us starts with our agronomist's recommendation. When the recommendation starts from a picture of the grower's own field, it is an easier conversation on both sides of the table.”